
Software
Beam elements with axial-flexural-torsion interaction
In this OpenSees-3.0.0 repo, two elements are modified (elasticBeamColumn and dispBeamColumn) and one element (mixedBeamColumn) is added so that the axial-flexural-torsional interaction behavior (such as LTB, FTB and TB) can be modeled. These elements originally were developed for collapse modeling of electrical transmission towers, which usually are made of steel angles, so warping is not considered. Both geometric nonlinearity and material nonlinearity are included. These elements have been varified with a lot of examples both on Window and Linux. Two of these elements have been added to the official OpenSees repository as dispBeamColumnAsym and mixedBeamColumnAsym and please see the official OpenSees documentation for how to use them. It is similar to use these elements with OpenSees-3.0.0 and only the element names are a little different. Here are the links of the official OpenSees documentation for dispBeamColumnAsym and mixedBeamColumnAsym.
References:
Du, X., & Hajjar, J. (2021). Three-dimensional nonlinear displacement-based beam element for members with angle and tee sections. Engineering Structures, 239, 112239.
Du, X., & Hajjar, J. F. (2021). Three-dimensional nonlinear mixed 6-DOF beam element for thin-walled members. Thin-Walled Structures, 164, 107817.
Hurricane Wind Records Clustering and Selection
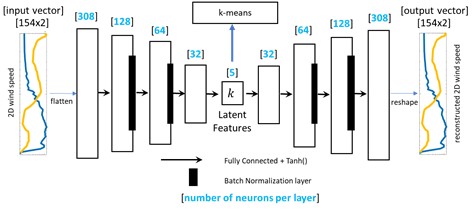
This repo contains codes used to select representative records for fragility development. The hurricane wind records are clustered by their patterns in changing of wind speeds and directions, and then a set of wind records is selected from each cluster. Since the wind records are time series with different length, it is difficult to cluster the records directly. To facititate the clustering process, the wind records are first compressed using an artificial neural network autoencoder to obtain low dimensional latent features of the time series. The architecture of the autoencoder is presented in the following figure. It shows that the wind speed records are compressed into 5 latent features through the encoder process, which then are expanded to the reconstructed wind records through the decoder process. The training of this autoencder is conducted by minimizing the error between the reconstructed and the original wind records, which ensures that the 5 latent features can represent the important patterns of the wind records.
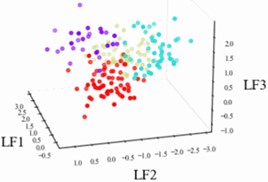
After the training process, all wind speed time series are converted into latent feature vectors, on which the k-means algorithm is applied for clustering. The wind records in this example are divided into 4 clusters. The following figure shows the first 3 latent features for the 4 clusters, from which it can be seen that the hurricanes are clustered well because different clusters have almost no overlap and the latent features for each cluster are gathered closely around their centroid.
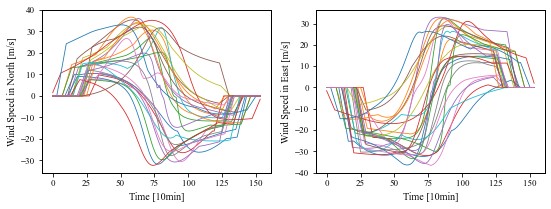
The following two figures illustrate the hurricane wind speeds of Cluster 1.
The following two figures illustrate the hurricane wind speeds of Cluster 2.
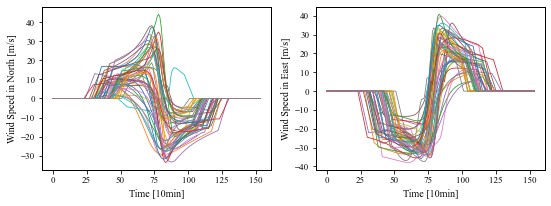
It is seen that the clustering results are reasonable because hurricane wind speeds and durations within each cluster have similar patterns. The other two clusters provide similar results to these.
References: Du, X., Hajjar, J.F., Bond, R.B., Ren, P., and Sun, H. Clustering and selection of hurricane wind records using a machine learning approach. Engineering Archive. https://doi.org/10.31224/2572. (Under review for ASCE Journal of Structural Engineering)